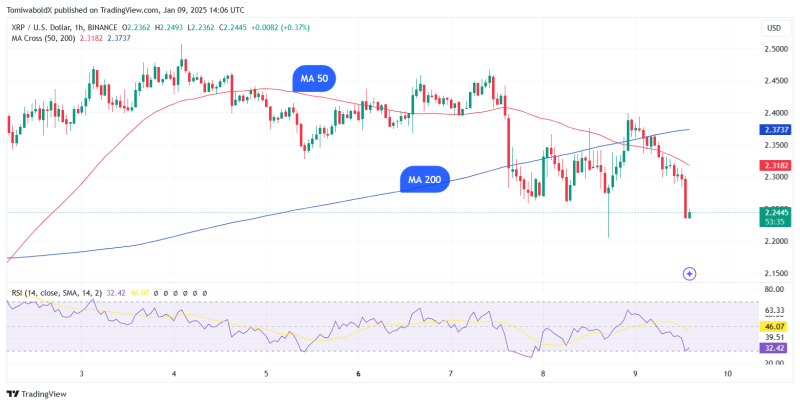
XRP, the fourth largest cryptocurrency, has flashed its first bearish signal of the year, with a death cross emerging on the cryptocurrency’s hourly chart.
The death cross signal, which occurs when the 50-hour moving average crosses below the 200-hour moving average, suggests potential downward momentum. This development comes amid a broader market sell-off that has seen $482 million in liquidations over the last 24 hours, per CoinGlass data.

The death cross pattern on XRP’s hourly chart is the first such occurrence in 2025. It might indicate that short-term bearish pressure may be building up after upward momentum at the very start of 2025.
HOT Stories XRP Forms First Bearish Signal of 2025: Details Ripple President Highlights Key RLUSD Use Cases After Recent Interview Crypto Liquidations Hit $483 Million With ETH, SOL and XRP in Spotlight Doge Meme Appears in US Senate: 'Doge Inevitable'; Dogecoin Founder Reacts
Previously, XRP had shown bullish indications, with golden cross patterns appearing on both the one-hour and four-hour charts. A golden cross occurs when the 50-period moving average crosses above the 200-period moving average, indicating potential upward momentum. However, the recent formation of a death cross on the hourly charts raises concerns about XRP’s short-term price momentum.
XRP’s short-term price bottom?
The death cross indicator’s track record as a predictor of bear markets is uneven. Moving average crossovers are unreliable as independent indicators since they rely on backward-looking data and tend to lag behind prices. The market is frequently oversold and due for a rebound by the time the crossover is confirmed. If this is the case, the market would be closely watching the XRP price for signs of a potential rebound.
XRP has had mixed price action since the start of the week, with two out of five days in the green since Sunday.
XRP is currently trading down, reaching lows of $2.23 during today’s session. At the time of writing, XRP had declined 3.32% in the last 24 hours to $2.25 and down 7.49% weekly.
The good thing is that bulls have held above the daily SMA 50 support at $2.176, which remains a positive signal. A break above $2.50 might spark a new rally toward $2.72 and then $2.90.


